
|
|
#1 |
|
Участник
|
powerobjects: Analyze Performance in Dynamics 365 Finance and Operations with Performance Timer
Источник: https://www.powerobjects.com/2018/04...ormance-timer/
==============  There are a number of ways you can analyze performance in Dynamics 365 for Finance and Operations such as using Trace Parser, the monitoring tools in Life Cycle Services, or leveraging the Performance SDK in Visual Studio. In today’s post, we are going to look at another one of the tools available for troubleshooting performance issues in Dynamics 365 for Finance and Operations – Performance Timer. Performance Timer is easy to load up and use to get some quick insight in to how specific actions are performing right from the browser window. To open the Performance timer, open your Dynamics 365 Finance and Operations webpage URL with the added parameter debug=develop appended to the end. Example: https://yoursiteaos.cloudax.dynamics...&debug&develop. Once the page loads, you will be able to see the Performance Timer loaded up in the menu bar.  To use the tool navigate to the form or page you wish to analyze. After the page loads click the Timer to get results. You will be presented with a screen similar to the screenshot below that shows the separation between server time and client time. 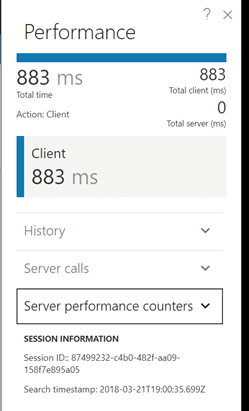 From there you can drill in to the different sections of the Timer results to find more information. Under History, you can see a list of recent calls to drill in to and view the longest running SQL statement from that session. 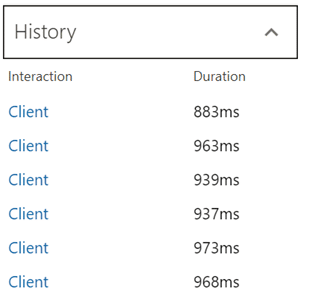 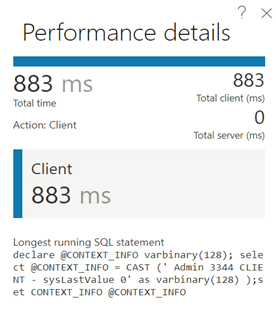 You can expand the Server section take a look at the server calls and drill in to those to see more details on the queries that are being run. 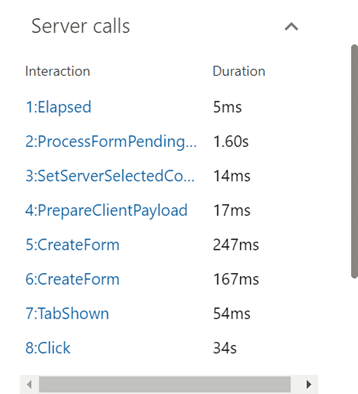 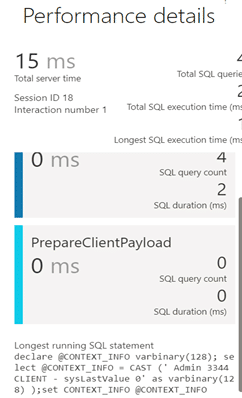 The server performance counters can also be drilled in to for more information. 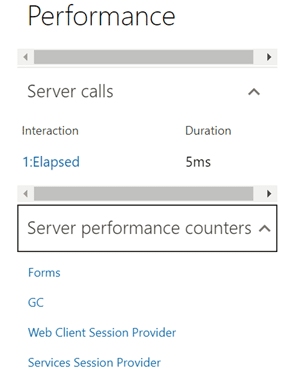 Forms – Forms will show how many forms are currently open, plus the rate at which they opened and closed (per second), and a set of counters, such as the total amount of created or closed forms. GC – This is information about the garbage collection processes on the server. Web client session – This shows how many web client sessions you currently have and how many are in use. Services Session provider – This is the total number of sessions created. If you click on one of the links you can then see the SQL queries were triggered by this individual call and which SQL query was the most expensive. 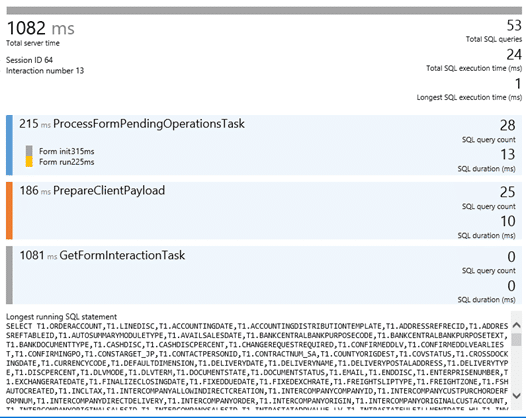 Troubleshooting performance is often a difficult task. Sometimes you aren’t sure even where to start. Using the Performance Timer is quick and easy to use and a good first step when trying to resolve any issues! Looking for more Dynamics for Finance and Operations tips & tricks? Be sure to subscribe to our blog! Happy Dynamics 365’ing! Источник: https://www.powerobjects.com/2018/04...ormance-timer/
__________________
Расскажите о новых и интересных блогах по Microsoft Dynamics, напишите личное сообщение администратору. |
|
|
|
|
|